
Suspension P,S Wave Velocity Logging System
The Suspension P-S Logging Technique developed by the OYO Corporation in Japan was used in this project to measure the primary wave velocity (Vp) and the shear wave velocity (Vs) of the stratum (Figure 1-3). The source and the receiver of this measuring system were integrated into a single probe within a short distance. Therefore, the wave velocities of the stratum can be measured continuously and precisely.
A borehole was first drilled at the chosen site and then filled with water. If the surrounding soil on a borehole is not stable and is easily eroded, the borehole may be lined with a plastic tube. The probe was then put into the borehole at a specified depth. A primary wave or a shear wave may be generated by the source in the probe. The primary wave was propagated through the surrounding soil in the direction perpendicular to the borehole axis (horizontal direction). Also, the shear wave was propagated through the soil along the vertical direction. Each receiver consists of a hydrophone and a geophone in receiving the primary wave and the shear wave, respectively. A normal pulse and a reverse pulse were triggered by the source in order to check the received signals. The time histories of those received signals should then be in the same shape but with 180 degrees phase difference, since the two shear waves were propagated through the same soil media.
Typical measured signals of the primary waves and the shear waves from the logging computer are shown in Figure 4, where H1 and /H1 represent the signals received by the upper receiver in normal and reverse directions, H2 and /H2 represent the signals received by the lower receiver in normal and reverse directions, V1 and /V2 represent the signals received by the upper and lower receivers, respectively. From the time histories of H1 and H2, the first arrival time for the upper receiver and the lower receiver was picked as ts1 and ts2. Since the distance between the two receivers is 1 m , the shear wave velocity can be determined as:
Similarly, the primary wave velocity is:
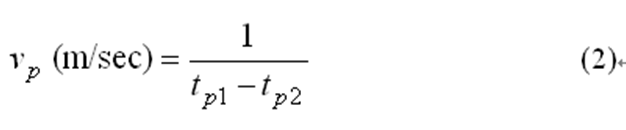

Figure 1 Suspension P,S Wave Velocity Logging System. Picture from GeoVision (John Diehl, 2001)
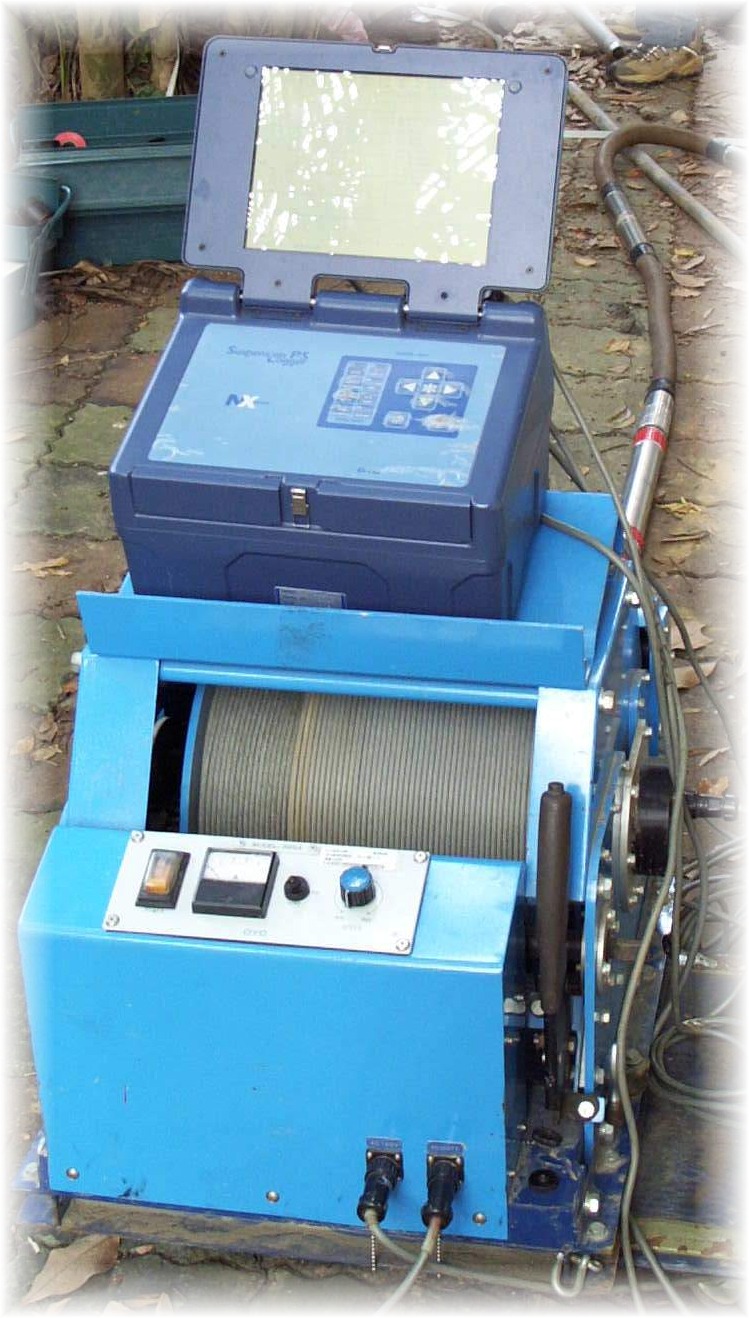
Figure 2 The Recorder and Winch.
Figure 3 The Probe.
Figure 4 Typical measurements from the Suspension P,S Wave Velocity Logging System.